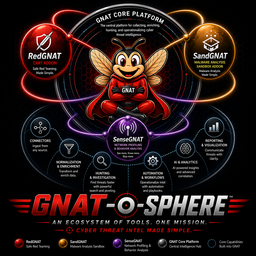
GNAT-o-sphere
An Ecosystem of Tools. One Mission.
Cyber Threat Intel Made Simple
Security teams keep rebuilding the same things
- New vendor → new integration to write from scratch
- New tool → new data model to normalize against
- New workflow → starts from zero every time
- Every API change upstream breaks something downstream
- The actual analysis gets buried under integration work
Integration work isn't analysis
- Analyst hours spent on plumbing, not investigation
- Brittle toolchains that break when APIs change
- Workflows that can't survive a vendor switch
- Intelligence siloed inside individual platforms
- Reports rebuilt manually each cycle
- Onboarding new tools resets your workflow investment
Standardize the surface.
Liberate the workflow.
- One integration framework — 159 connectors behind a single operating model
- One data standard — STIX 2.1 as the stable contract between every tool and workflow
- One investigation platform — your work travels with you regardless of what changes upstream
Five tools. One connected platform.
GNAT
Core platform. Investigation hub. Connector framework. STIX-native.
SenseGNAT
Network profiling & behavioral anomaly detection.
SandGNAT
Automated malware detonation & artifact enrichment.
RedGNAT
Controlled adversary emulation & detection validation.
GNAT-gui
Desktop GUI — investigations, hypothesis tracking, rules authoring, automated reporting.
GNAT — GNAT's Not A TIP
- 159 connectors — ingest from feeds, platforms, and APIs without custom code for each
- STIX 2.1 native — every object, relationship, and finding expressed in a vendor-neutral standard
- Investigation workflows — build repeatable paths from indicators to evidence to reports
- Addon routing — direct artifacts and telemetry to SenseGNAT, SandGNAT, or RedGNAT
- Portable output — export structured bundles, reports, and findings that travel independently of GNAT
Not a TIP
GNAT is an investigation and workflow platform built around a connector surface and a structured data contract — not a threat intelligence platform in the traditional sense. It's designed to reduce integration churn, not add to it.
Works with the stack you already use
Threat Intel
CrowdStrike · Recorded Future · MISP · VirusTotal · Mandiant · Anomali · OpenCTI · MITRE ATT&CK · +16 more
SIEM & Log
Splunk · Microsoft Sentinel · Elastic · IBM QRadar · Google Chronicle · Wazuh · +6 more
SOAR & IR
Palo Alto XSOAR · TheHive · ServiceNow · Jira · FortiSOAR · +2 more
Endpoint & EDR
SentinelOne · Carbon Black · CrowdStrike · Tanium · Trellix · Sophos · +14 more
Network & NDR
Zeek · Suricata · Snort · Vectra AI · Darktrace · ExtraHop · +3 more
Cloud & ASM
Wiz · AWS Security Hub · Censys · Shodan · Palo Alto Prisma · +11 more
Vuln & Identity
Tenable · Rapid7 · Qualys · Okta · Microsoft Entra · +8 more
Sandboxes & More
ANY.RUN · Joe Sandbox · Hybrid Analysis · Intezer · +MDR, DFIR, Email, DevSecOps
Extend the platform where you need it
SenseGNAT
Network & behavioral layer
- Consumes Kafka telemetry stream
- Anomaly detection & profiling
- Runs before STIX conversion
SandGNAT
Malware analysis layer
- Automated detonation
- Static + dynamic analysis
- CAPA, YARA findings
RedGNAT
Validation layer
- Controlled adversary emulation
- Explicit safety boundaries
- Detection coverage testing
SenseGNAT
Behavioral profiling & anomaly detection on network telemetry
Why it exists
- Indicators alone miss behavioral threats
- STIX conversion strips flow-level detail that behavioral models need
- SenseGNAT runs before that conversion on the raw Kafka stream
What it outputs
- Anomaly findings with confidence scores
- Behavioral narratives
- Normalized detection outputs for GNAT
- Enriched context for investigations
SandGNAT
Automated malware detonation & artifact enrichment
What it does
- Detonates suspicious files, URLs, and derived artifacts
- Runs static and dynamic analysis
- Applies CAPA and YARA rule sets
- Feeds findings directly into GNAT investigations
What it outputs
- Extracted indicators from detonation
- Static & dynamic behavioral observations
- CAPA / YARA-derived findings
- Artifact bundles for investigation evidence
RedGNAT
Continuous Automated Readiness Testing with explicit safety boundaries
What it does
- Controlled adversary emulation against real TTPs
- Explicit safety boundaries — no runaway execution
- Tests detection coverage and response capability
- Designed to run collaboratively, not covertly
What it outputs
- Detection coverage gaps
- Validation results by technique
- Structured notes for investigation follow-up
- Evidence for reporting and remediation tracking
The Canonical Workflow
STIX 2.1 — Why It Matters
- Industry standard — structured, vendor-neutral threat intelligence format
- Stable contract — your downstream workflows don't break when upstream tools change
- Portable intelligence — investigations and reports travel independently of any platform
- Reproducible — the same indicators and relationships produce the same structured output
What it prevents
Rebuilding report templates, re-normalizing data, and re-wiring workflows every time a vendor changes their API or data model.
What it enables
Sharing investigation context across teams, tools, and organizations without translation layers.
Correlate broadly. Keep your work portable.
- Ingest from 159 sources without managing individual connectors
- Correlate indicators, behavioral findings, and detonation results in one investigation
- STIX-native output means reports survive tool changes
- SenseGNAT surfaces behavioral anomalies you'd miss with indicators alone
- GNAT-gui provides a desktop interface if you prefer not to work in the CLI — same workflows, no terminal required
The shift
From: spending cycles normalizing feeds and rebuilding report templates
To: spending cycles on the actual analysis — with all sources and findings already connected
A repeatable path from signal to report.
- Start from any seed indicator — IP, hash, domain, artifact
- Investigation graph links indicators, observations, and findings automatically
- SandGNAT detonates suspicious artifacts mid-investigation without leaving the workflow
- Structured export: STIX bundles, operator reports, case notes
- The same workflow runs the same way every time — reproducibility by design
The result
Investigations that don't rely on a specific analyst knowing the right steps — because the steps are encoded in the workflow, not in someone's head.
One integration surface. Durable workflows.
- 159 connectors behind one operating model — no custom connector per source
- API changes upstream don't cascade to your investigation workflows
- STIX as the stable downstream contract between tools
- Addon architecture: add SenseGNAT, SandGNAT, RedGNAT independently
- Apache 2.0 — no licensing risk, full source access
The maintenance difference
Instead of maintaining N connectors and N data model mappings, you maintain one integration surface. Vendor churn becomes a connector update, not a workflow rebuild.
Start small. Expand where it matters.
- Deploy GNAT Core — connect your existing sources, build your first investigation workflow
- Validate the connector surface — confirm your key feeds and platforms are covered, add any missing connectors
- Add SenseGNAT — if you have network telemetry, extend behavioral visibility before it's normalized away
- Add SandGNAT — bring malware and artifact analysis directly into investigation workflows
- Add RedGNAT — validate detection coverage and close the loop from investigation to readiness